What Are TOU Rates & How Do They Affect My Solar?
Ok, so TOU Rates...
Everybody talks about what they are, but nobody talks about how they could affect you after going solar.
If that's what you're here for, you couldn't have arrived at a better time. Let's do this!
First of all, Tiered Plans
As of today, you're probably enrolled in a Tiered Rate Plan. Depending on what utility you're with and what part of the area in which they provide service you are located, they will assign you something called a Baseline.
You could think of it as the maximum amount of energy (in kWh) which they consider you should be using in a month according to where you live.
These baselines change 2 times per year. There's one for the summer months (June through September) and another one for the rest of them.
For example, take a look at this map. That's the region of California that SCE is in charge of providing service to:
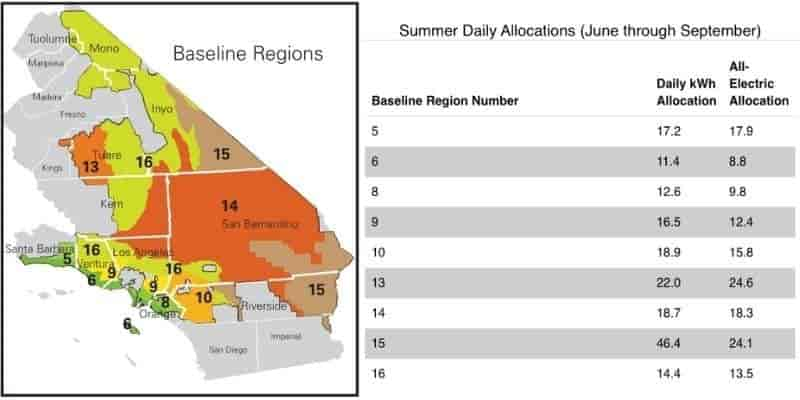
Example: If you live in San Bernardino, that would be Region 14. During summer the maximum allocation per day is 18.7 kWh. If you multiply that times 30 days, you'll get the baseline allocation for the month = 561 kWh.
If you happen to use
more
than that amount, this will happen:
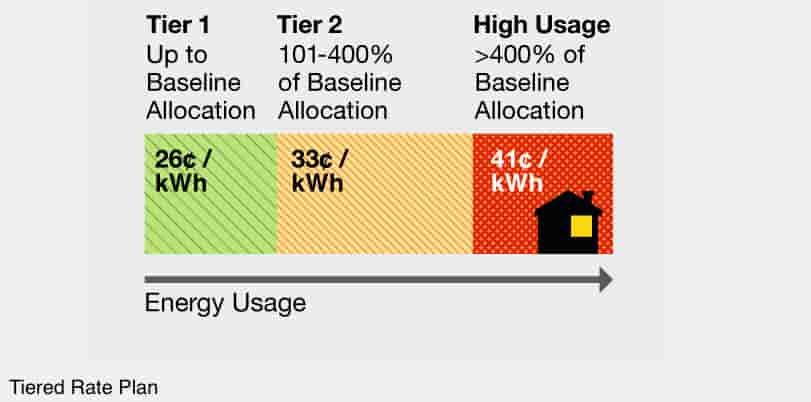
They will start charging you at a
higher rate according to what Tier you fall into. They determine this by how far above your consumption falls from your baseline.
That's tiered rate plans in a nutshell.
Going back to TOU Rate Plans...
Nowadays, when yo go solar, you automatically get switched over to a TOU Rate Plan instead of the classic tier plan I just showed you. That's if you were not already enrolled in one.
Baseline allocations still apply with a TOU Rate Plan, meaning that Tiers work the same way here.
The only difference would be that instead of having a fixed price per kWh, its price will change according to the time of the day.
That's what TOU stands for, "Time Of Use".
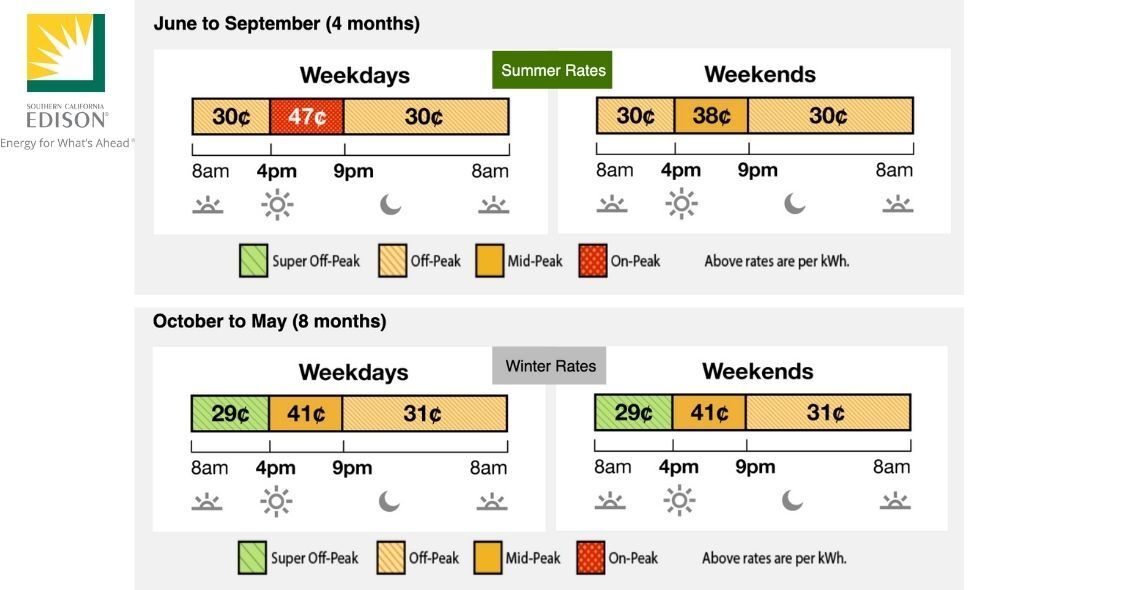
Take a look:

This might have you thinking: "How does it
affect me if I go solar?
Picture this...
Let's say that today, from 8:00 am to 3:59 pm, your system generated an extra 10 kWh you haven't used. And it just so happens that Peak Hours in a TOU Rate Plan are from 4 pm to 9 pm as you just saw.
6 pm hits and the sun starts going down. Your solar production will ramp down due to the fading sunlight.
That means that your panels won't be able to produce all the energy your house would call for at that precise moment. But hey, you had an extra 10 kWh ready to go right?
Yes and no! The problem here is that energy also gets credited according to the time of day in which it was generated.
Example: Those 10 kWh generated from 8:00 am to 3:59 pm are worth $3 (10 kWh x $0.30 = $3). For the sake of this example, let's say you used them all up during peak hours.
If we did 10 kWh x $0.47 -which would be the cost per kWh during peak time- that would be $4.7 bucks of energy. It's like you had technically used $1.70 more in energy.
Of course, in a real-life scenario you wouldn't use them all up exactly during those hours, but it just goes to show the repercussions that changing to a TOU Rate schedule has for solar.
How to counter TOU Rates ?
It's relatively easy, check this out...
Let's pretend that you would only need 30 panels to reach an Offset of 100%. For most solar companies and homeowners, that should do the trick. However, your system would not be accounting for TOU Rates.
At least not yet.
So what do you have to do?
Get more panels than the ones originally needed.
The extra energy that will come from that, will counter the price difference during peak hours.
But it's not like you could just say, "hey give me double the system size", as if it were a double shot of espresso.
No, several things come into play when making an accurate design and at the end of the day, that falls into the jurisdiction of solar companies and their designers.
However, since you & I know that most of them will
hide things from you
in order to "get the sale", here is something that will help...
How much bigger should my system be ?
Let's turn you into a solar system designer for a minute here...
See the image below?

In the solar world we call that a Load Profile.
In the real world in which you and I live in, that's called -how much electricity you're using at any given time of the day according to your habits-.
For example: there's people that will consume more energy at night because they were at work all day, while there are others who work from home so their highest usage could probably be in the morning or during midday.
And just like those, there's a hundred different load profiles out there. But the one from above, is the average one, so let's use that.
Now, to calculate how much bigger should your system be, let's split that graph into chunks of 1 hour to see how much energy of the total used in a day, was consumed during TOU hours.
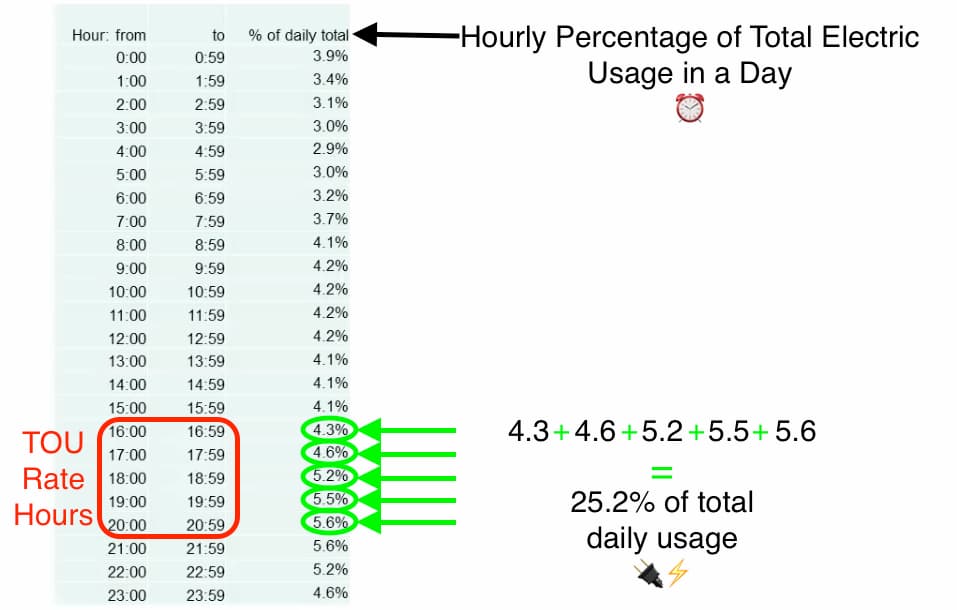
Image taken from our friends at NorcalSolar.org
TOU Rates are from 4 pm to 9 pm, remember? So let's take the percentages circled in green, which would be the electric usage that corresponds to those hours, and add them all up.
Result: the average american house would consume 25.2% of their daily total during TOU hours.
Ok, now that we know that, let's do some math again. I'll divide it into steps so you can follow.
One more thing before we start, I'm going to use 30 cents as off-peak price and 47 cents as peak-time price for my calculations. That would be SCE's pricing during summer.
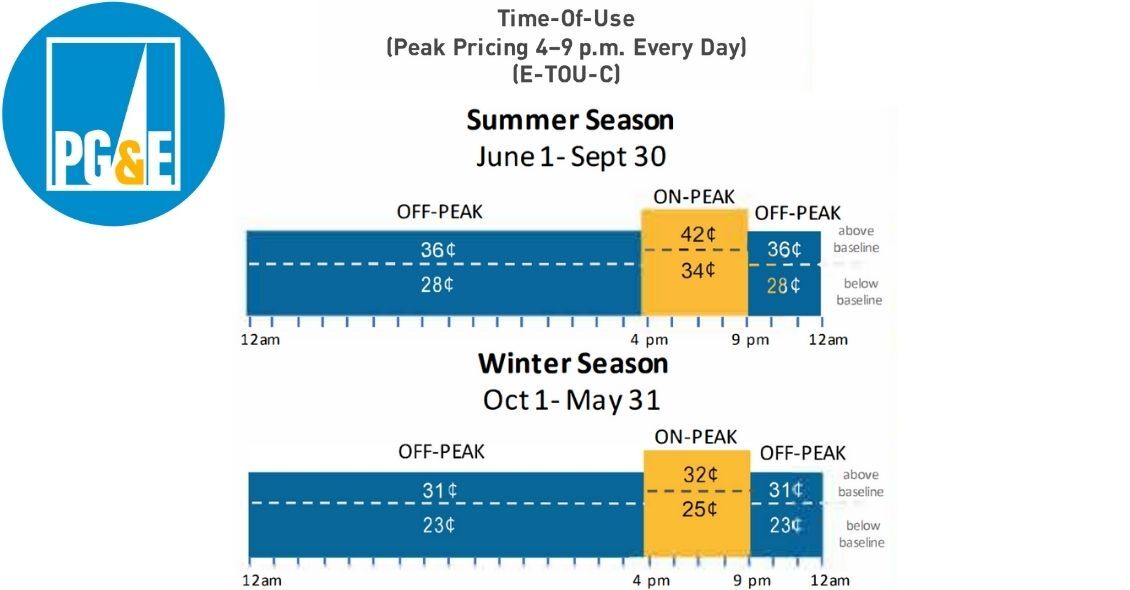
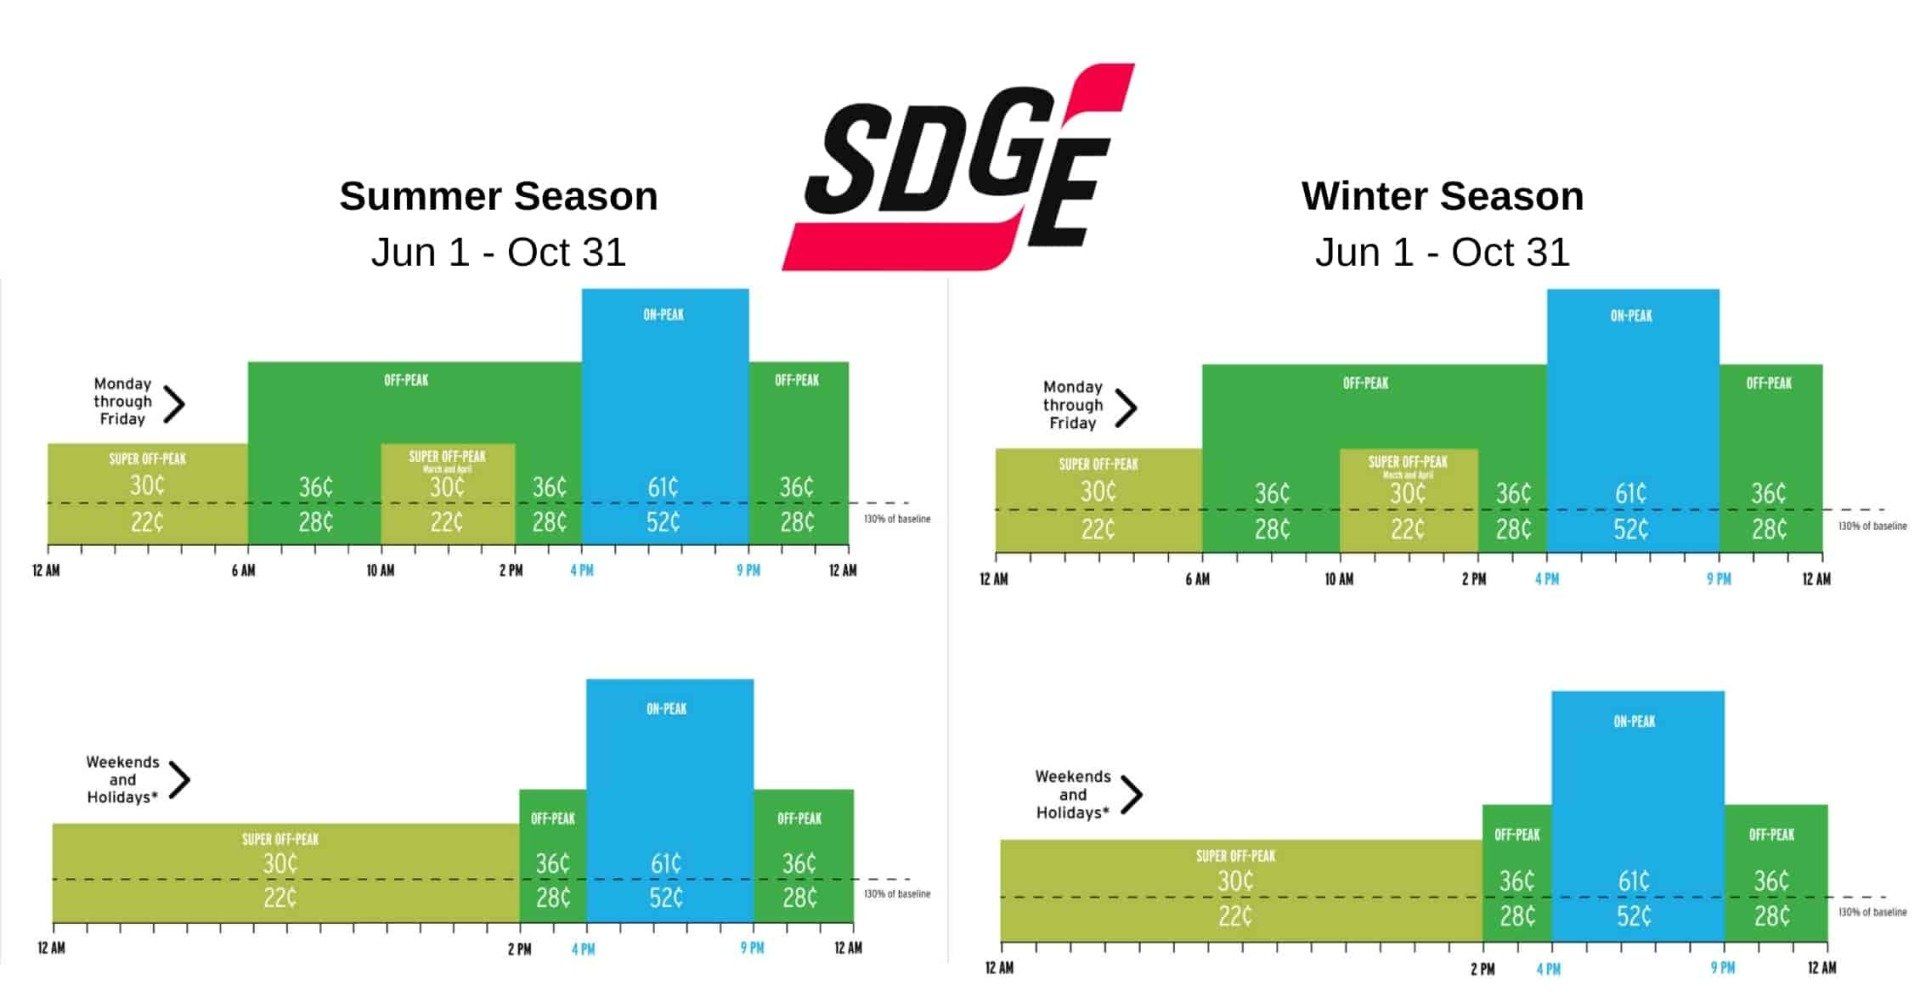
💡 However if your utility is SDG&E or PG&E, just
pick the corresponding values from the images below and follow the steps.
Quick Clarification
⚠️ Remember that if you don't handpick one of the TOU Rate Plans your utility has available, the default one will be the -4 pm to 9 pm- showed in the images above.
If you want to learn more about the different plans available & their pricing straight from the source, here are the links to the utilities' websites where I got the images from:
With that said, let's get back to our calculations...
Step #1: Figure out your consumption in kWh during TOU times.
To do that, multiply your average monthly usage by 0.252.
Example: let's say you consume 500 kWh on average per month. 25.2% of that will be during TOU Rate Hours, which in kWh would be 126. (500 kWh x 0.252 % = 126 kWh).
Step #2: Calculate the price of that chunk of consumption.
Multiply the result you got from above by the price per kWh during off-peak time and then do the same for the price during peak time.
Example: those 126 kWh were probably produced during off-peak times. That means they were credited at ¢30. In dollars that would be $37.8 (126 kWh x $0.30 = $37.8).
However, since we claimed that energy back from the grid during peak time, it now costs ¢47. So it would be a total $59.22 (126 kWh x $0.47 = $59.22).
That's a difference of $21.42 ($59.22 - $37.8 = $21.42). Now it's just a matter of turning that into a percentage.
Step #3: Turn that into a percentage.
Turn that difference in dollars, into a percentage using the peak-time dollar value as a reference.
In this case we would have to figure out what percentage would $21.42 be out of $59.22? To do that divide the lower value by the big one.
Why $59.22? Because that's the
real value of the energy during TOU times.
Example:
$21.42 ➗ $59.22 = .3617 which in % would be
36.17%.
OnIn this case it would be 36%.
e more step and we're done.
Step #4: Turn that into a percentage.
Now we need to know what's the 36.17% of 25%.
Why 25%? Because that's the average percentage of monthly energy usage for a house, according to load profiles. Remember?
Example: 25 x 0.3617 = 9%
✅ That would be the average amount of extra energy needed to
counter TOU Rates: 9%.
And last but not least...
A bigger system size is a MUST if you want to combat TOU rates.
However, remember that you won't always need an extra 9%. Some houses will require a little less and some others more.
That will depend your type of load profile and other factors like how much sunlight your roof gets, during what hours, where it's facing, how much energy you consume, among others...
As you can see, it's quite a little something to do it all by yourself.
But what you CAN do is this:
Now that you know this, make sure that when you get your project done, they explain to you the measures they're taking to prevent this from getting back at you. And how & why they'd work. 👌
Share with those who you care about.
Let us know what you think...


